Technology
10 Tanker: The Wildfire Globe Trotter
Discover more about 10 Tanker and its rich history of opening up new markets for aerial firefighting and excelling at putting out blazes.
In 1910, the Big Burn wildfire devastated three million acres across northern Idaho, western Montana, eastern Washington, and southeast British Columbia.
The fire killed 87 people, mostly firefighters, and set the U.S. Forest Service (and fire agencies in general) onto the path of total fire suppression of any wildland blaze for nearly a century.
As a result, many forests are choked with overgrowth which has fueled mega-fires (fires which burn more than 100,000 acres) that have broken all records for damage done amid swelling fire suppression budgets. In 2018, wildfires in California alone ran up a tab of over $12 billion in insured losses and fire agencies across the U.S. spent over $3 billion suppressing them.
Fire agencies at the federal, state, and local level are now faced with the daunting task of using controlled burns and mechanical thinning to reduce fuels in forests that climate change has turned into tinderboxes before they ignite and burn up communities which are increasingly pushing into wildlands. But which areas should be treated first?
1. FSim
3. Landfire
Greg Dillon, a Spatial Fire Analyst with the U.S. Forest Service’s Fire Modeling Institute at the Rocky Mountain Research Station (RMRS) in Missoula, Montana, offered up something which could help focus wildfire mitigation efforts on the most dangerous areas in the U.S. It’s called FSim (the Large Fire Simulation System).
“FSim is a means of modeling the way that fire spreads across the landscape given topography, weather and fuel data,” Dillon explained. “It allows us to map hazard and risk at a national scale.”
This large fire simulator model was developed by USFS scientist Mark Finney at the Missoula Fire Sciences Lab. FSim is built on the same Rothermel surface fire spread equation that is at the heart of every one of the USFS fire models, including FlamMap, FARSITE and spatial fire prediction models in the online Wildland Fire Decision Support System (WFDSS).
“What’s really cool about FSim in terms of informing hazard and risk from a strategic perspective is that FSim, instead of simulating a single event, like we’re doing with fire behavior models, is simulating fire in your modeling area across an entire season,” said Dillon.
Weather data is an important part of FSim. “You feed it weather information, usually based on RAWS [Remote Automatic Weather Stations] data, but there are ways to feed it gridded information over some time period, like 20 years or so,” Dillon continued. “And then it generates statistically possible weather streams for an entire season, using even temperature correlation, where temperature on one day is related to temperature on the previous days.”
FSim pulls in all of that data to create synthetic weather streams to give scientists the full range of all the possible weather scenarios that a place might encounter. It then iterates through numerous versions of the upcoming fire season, running 10,000, 20,000, or 50,000 iterations of the projected season.
“In each of those iterations, FSim is placing ignitions on the landscape, it’s spreading fire and there are perimeter-trimming algorithms in there so that if the ERC [Energy Release Component] drops below some level for a few days it knows that the fire is probably going to stop growing in directions where suppression happens,” said Dillon.
“What we get out of that is this great big data set of simulated fires and ignition points and a set of aggregated raster products which we can use to talk about hazard and risks.”
“The raster products FSim creates provide maps of annual burn probability, which is the likelihood of any spot on the landscape experiencing fire in a given year with the fuel conditions entered into the model, independent of any weather forecast for that year.”
Dillon pointed out the importance of those raster products.
“It’s really good for long-term strategic planning because what it gives us across the full range of possibilities is the relative likelihood of fire across the landscape. When we have these measures of burn probability, each pixel experiences some fire intensity in its simulation, so that’s recorded and we can know from the simulation the potential for different fire intensities under different fire conditions, so we get conditional flame-length probabilities out of the model. It shows the percentage chance of a certain flame length occurring if there’s a fire there.”
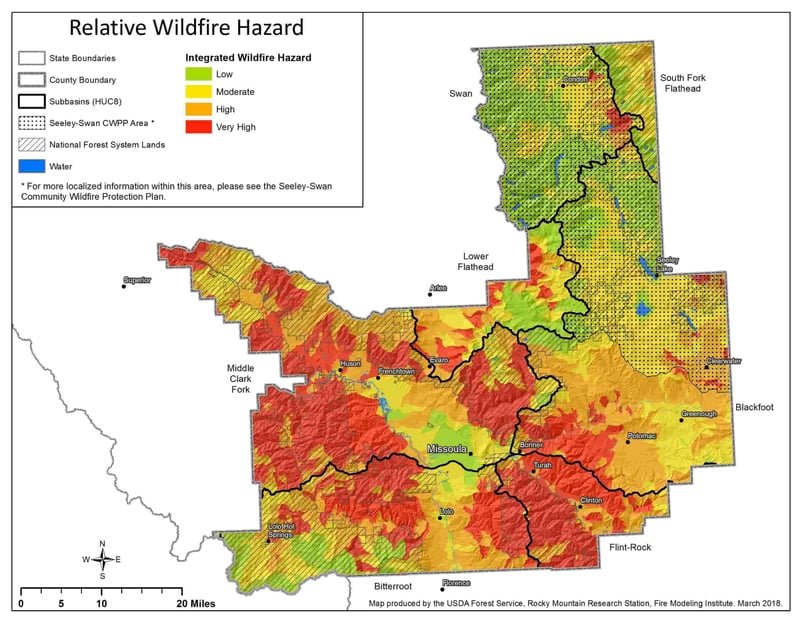
To understand FSim, it’s important to visualize the wildfire risk triangle, whose three sides represent likelihood, intensity and susceptibility.
“The FSim model gives us information on the likelihood of fire, and the potential intensity of fire,” Dillon explained. “Those two pieces together make up the integrated hazard. We can add in that third leg on the triangle, which is the susceptibility of things on the ground that are of value, including houses, business structures, wildlife habitat, power transmission towers, etc., and the benefits/detriments of fire in that area, so we have a way of quantifying the effect of fire on those resources and assets, then working that in as a susceptibility measure to the risk assessment to provide all three pieces to that risk triangle. That allows us to determine the wildfire risk across the landscape.”
Another key component in determining the hazard or risk on a given portion of real estate is the data provided by Landfire, which consists of over 20 geospatial layers of data, including such things as fuel, vegetation, and fire regimes, across the U.S.
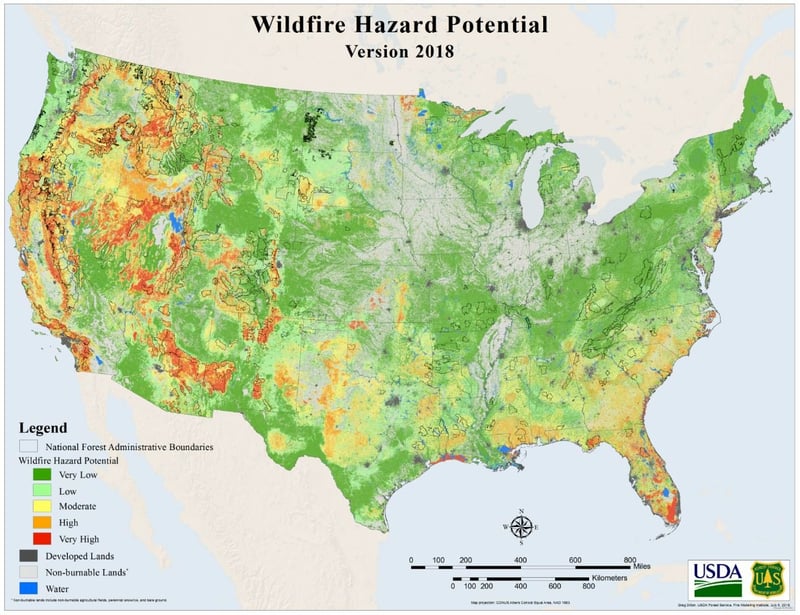
“This national-level of FSim modeling is led by Karen Short, here in Missoula with RMRS. Each time there is a new iteration of Landfire, she takes the Landfire data and runs FSim on little chunks of map data around the country, then aggregates it back together into a national mosaic.”
Dillon then takes that information and applies some weighting, which yields an index of wildfire hazard potential that combines the flame-length probability and the burn probability, which is a national map product.
“Its intention is to help guide fuel treatment prioritization for the U.S. Forest Service, so some of the weightings we apply are fairly forest-centric. We’re looking at a fuel treatment being more effective in reducing fire risk in forested ecosystems than in grass and shrub ecosystems. So this is a fuel-treatment prioritization product.”
With major wildfire disasters multiplying each year, RMRS is getting a lot of interest from various groups. “In recent years with the big fire disasters we’ve had that have affected communities, the insurance and reinsurance industries are showing a lot of interest,” Dillon disclosed.
“After the Santa Rosa wildfires [the Tubbs Fire] I was getting calls from an insurance company that was saying ‘What we see in your wildfire hazard potential seems to track really closely with where we saw the highest damage,’ which was interesting to me. Some of these insurance companies have their own analytic groups.” And those analytical groups could help RMRS with FSim work.
“Karen Short and Mark Finney have been developing some communication with the reinsurance industry and there may be potential for some collaboration there to help further develop the FSim model because they have computer resources way beyond what we have in the government. There’s some potential for public-private partnerships there.”
Insurance companies, which only show a profit if they can keep the claims down, consider the work RMRS is doing to be important to their bottom line.
“I think everyone is realizing that we’re all in this game together,” Dillon summed up.
And insurance companies often realize that they have to spend money to make money, particularly in regards to research and development. This could make them a prime funding source for FSim development.
“A lot of the work the Forest Service is starting to do is focused on cross-boundary efforts for fuel mitigation, so we’ve gotten pretty heavily involved in a program where we help do hazard risk assessments at a local community scale through the community planning assistance for wildfire program with Headwaters Economics. They had land-use planning and economics expertise, but they didn’t have the wildfire science expertise, so they came to us and formed a partnership. On some of their community assessments, we provide the type of hazard mapping that allows them to recommend that communities adopt codes and regulations related to smart development in the Wildland-Urban Interface [WUI].”
And some of those partnerships get close to home. “I had the opportunity to work with our own community here in Missoula County, which was going through a CWPP [Community Wildfire Protection Plan] revision and Headwaters was helping with that project,” Dillon recalled. “It was really cool. I ended up being able to do hazard maps and some other interesting maps for the whole county, using data you can get out of FSim, so they ended up rolling the FSim data into their CWPP and built a cool story map online.”
And as is often the case when the word gets out, more interested parties show up. “Other people see this and recognize the value. Here in Missoula it’s fostered a Cohesive Strategy working group that includes representatives from county planning, emergency services, fire services, the Lolo National Forest, the RMRS, and rural fire departments.”
As more people hear about FSim, and the RMRS continues to bring out more products, Dillon and his lab-mates are feeling a little pressed for time. “The challenge is trying to keep up with all the work there is to do in this arena. We come to a community or forest, whoever our client is, and more often than not they don’t have the skill set to run one of these risk assessments or hazard analysis. They have the local knowledge of what needs to be done, and about the fuels, but it’s our challenge as fire science experts to take their knowledge and implement it.”
More help may be needed – and soon!
“What we’d really like to do is start building capacity with more people who have the skills to do the analysis work. Interest is growing and the market is growing.
“We work with a small consulting firm here in Missoula, Pyrologix, which is run by Joe Scott, of the Scott-Burgan Fire Models, which sees the value of using FSim to run these types of analyses.”
Pyrologix is giving the RMRS a hand with a daunting government-directed task, as Dillon explained. “The 2018 omnibus bill had a specific section in there about a national map of wildfire hazard, and unlike our current wildfire potential map, this spelt out that it had to be a fine enough scale to be useful to communities and provide information for them to assess their local wildfire risk. We’re working with Pyrologix right now to develop a prototype for that and looking over the course of the next year to implement that nationally.”
And communities stand to benefit from that partnership.
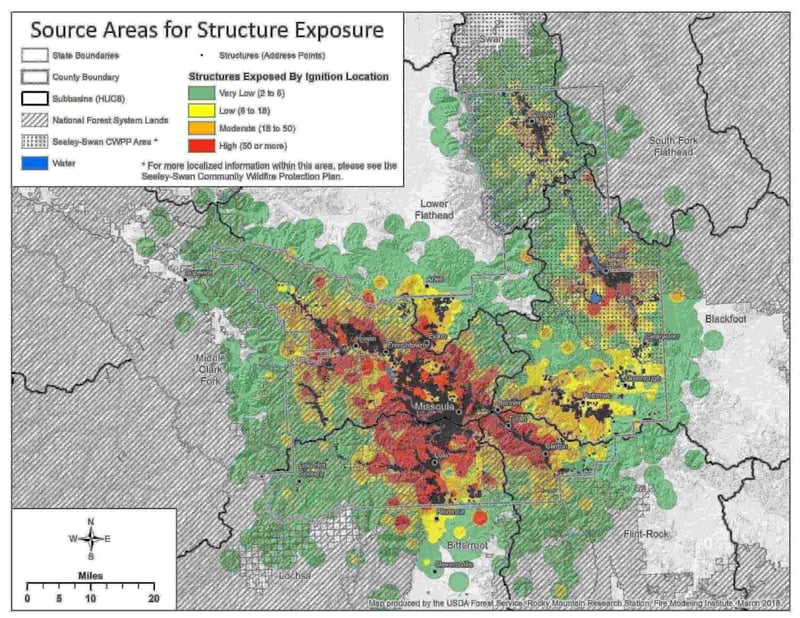
“I think that’s going to provide interesting information for communities. Those FSim data are going to allow us to do an exposure analysis for communities where we’ll be looking at the number of housing units exposed to wildfires, the amount of population exposed to wildfires, and then, within each state, rank the communities that are most highly exposed to wildfire, which can hopefully direct peoples’ attention to where we need to be doing the mitigation work. Within each of those communities, there will be data summaries of things like the annual burn probability, the conditional fire intensity, the wildfire hazard and a couple of other metrics of hazards, and we may even provide those summaries by WUI map classifications in the interface and intermix. This will provide the opportunity for states and communities to be able to compare where hazards are greatest.”
Discover more about 10 Tanker and its rich history of opening up new markets for aerial firefighting and excelling at putting out blazes.
Learn more about SEATs and why they are considered heroes from Ravi Saip, Air Spray’s Director of USA Operations himself.
Learn more about how the Alaska Division of Forestry faces another daunting year, further complicated by the COVID-19 pandemic on the last frontier.